A series, D series, DS series, F Series, G series, H Series. Azure offers many different types of SKUs at different price points. As you start to leverage the cloud more and more, you will sooner or later take performance and pricing into consideration if you haven’t already.
When Microsoft announces new Azure virtual machine SKUs, they tend to release it with the expected workload with very vague performance metrics.
A_v2 Series Announcement
“Today we are releasing 7 new general purpose compute VM sizes. In this new version of our A-Series VM’s we have raised the amount of RAM per vCPU from 1.75 GiB or 7 GiB of RAM per vCPU to 2 GiB or 8 GiB per vCPU. We have also improved our local disk random IOPS to be 2-10x faster than that of our existing A version 1 sizes.”
Dv2 Series Announcement
“A larger virtual machine size has joined the Dv2-series. This new size is the Standard_D15_v2 with the following specifications: 20 CPU cores, 140 GB of memory, 1,000 GB of temporary solid-state drive (SSD), up to 8 virtual network interface cards (NICs), up to 40 data disks, and very high network bandwidth. Each Standard_D15_v2 instance is isolated to hardware dedicated to a single customer, to provide a high degree of isolation from other customers.”
GS Series Announcement
“Today we’re excited to announce a variant of G-series, the GS-series, which combines the compute power of G-series with the performance of Premium Storage to create powerful VMs for your most storage and compute intensive applications. Powered by the Intel Xeon E5 v3 family processors, the GS-series can have up to 64TB of storage, provide 80,000 IOPs (storage I/Os per second) and deliver 2,000 MB/s of storage throughput. “
What most of these announcements don’t tell us is how the SKU CPU/cores compare against one another. You are simply being told. “This is a great high compute SKU.” “This is a shared SKU” “This SKU is meant for high Memory workloads”
So how do you understand the CPU/core performance in Azure VMs? – The Azure Compute Unit
Microsoft uses Azure Compute Unit (ACU) to compare the performance across their virtual machine SKUs. If there is any document you should review prior to selecting the VM size, it is probably this one. Under Performance Considerations, they list a frequently updated table similar to below.
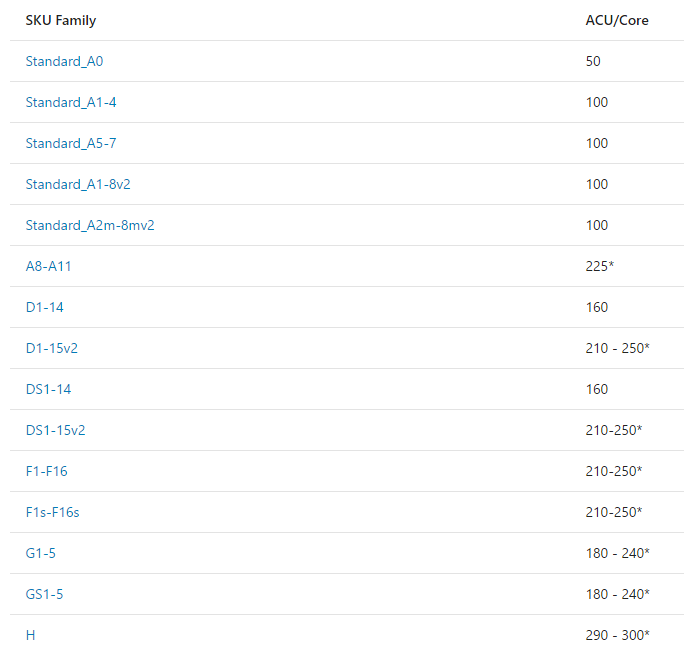
The ACU/Core column gives you an idea of what you can expect between different series of Azure virtual machines. The Standard_A1-4 series and 100 being the baseline metric. If you compare it to the Standard_A0 virtual machine which is at 50 ACU, you can expect essentially half the computing performance from the cores. If compared to the F1-F16 series, you would expect anywhere from x2 to x2.5 compute performance. Microsoft does specifically mention that the performance results vary by the sort of workload being done but if you do any sort of CPU benchmarking, you will see the ACU and benchmark results are pretty much spot on.
So whenever you are provisioning a new VM in Azure, you should always reference this chart as a pre-requisite.