Over time working with a multiverse of different crm instances, you begin to see recurring questions. Many of you have probably asked some of these questions; should you own your own (portal gun) dynamics crm instance. The one I wanted to discuss today is user adoption and gaining insights on how your system is being used leveraging Application Insights. There are a ton of different ways of going about this but for this post we are going to be focusing on a new novel twist with some great tools courtesy of ‘The Cloud‘.
With some of these techniques you’ll be able to answer questions like, do we use that command button or how often? What records did that joker Jerry open last month? What did the plugins do after that thing that time? Or even the next time like more than 4 exceptions go off send an alert email off. Which forms load slowest and for who?
Lot to take in but let’s get started and get schwifty

To build this we’re going to need:
1) Dynamics CRM instance (online or on premise)
2) Microsoft Application Insights (courtesy of azure)
3) XrmToolbox & RibbonWorkbench (Some excellent tools from the community; don’t be tripping dog we got you. ps ribbonworkbench is also available as a plugin with Xrmtoolbox)
Couldn’t do Application Insights enough justice in one post so please check the references below (includes handy videos and messages that are practically as good a McDonald’s Szechuan sauce for chicken nuggets). In short
“Application Insights is an extensible Application Performance Management (APM) service for web developers building and managing apps on multiple platforms. Learn how to detect & diagnose issues and understand usage for your web apps and services using our quickstarts, tutorials, and reference documentation.” ~docs.microsoft.com (aka Snowball)
How-to setup plugin tracking
First of all add a reference to the application insights dll. If you are using a crm online instance you’ll want to ilmerge this assembly as part of your project (quick how-to guide).
Furthermore, a good place to start would be at the top of your plugin context. This is critical in tracking how long your code takes to run server side
|
1 2 3 4 5 6 7 8 9 |
// Construct the Local plug-in context. using (LocalPluginContext localcontext = new LocalPluginContext(serviceProvider, ChildClassName)) { ///localcontext.Log.Start(); localcontext.Log.Info(string.Format(CultureInfo.InvariantCulture, “Entered {0}.Execute()”, ChildClassName)); // Start timer for App Insight tracking Stopwatch stopWatch = new Stopwatch(); stopWatch.Start(); |
The second bit to add is at the end of the execution code
|
1 2 3 4 5 6 7 8 9 10 11 12 13 14 15 16 17 18 |
// Stop timer for App Insight tracking stopWatch.Stop(); var InstKey = localcontext.OrgSettings[“ApplicationInsights.InstrumentationKey”]; TimeSpan ts = stopWatch.Elapsed; var CalledEntity = localcontext.PluginExecutionContext.PrimaryEntityName; var stage = localcontext.PluginExecutionContext.Stage; var properties = new Dictionary<string, string> { { “correlationid”, localcontext.PluginExecutionContext.CorrelationId.ToString(“B”) }, { “stage”, stage.ToString() }, { “object”, CalledEntity }, { “user”, localcontext.PluginExecutionContext.UserId.ToString(“B”) }, { “originatinguserid”, localcontext.PluginExecutionContext.InitiatingUserId.ToString(“B”) } }; ApplicationInsightsHelper.TrackEvent(CalledEntity + stage, properties, ts.TotalSeconds, InstKey); |
Important Note: the instrumentation key is stored in a settings record stored in crm in the example above.
(helper method for track event)
|
1 2 3 4 5 6 7 |
// Track event is used to send custom event information to App Insights public static void TrackEvent(string source, Dictionary<string, string> properties, double duration, string instrumentationKey) { var tc = new TelemetryClient() { InstrumentationKey = instrumentationKey }; tc.TrackMetric(source, duration, properties); } |
Most noteworthy from here is you can add as many properties as you wish. The way this ends up looking using analytics (provided by Azure)
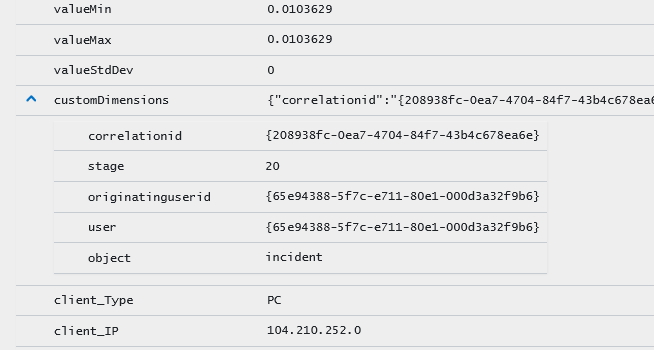
Especially relevant to note, both the executing user and originating user are tracked in the example above. Furthermore, if you wanted from here you could also add the object’s attributes and values here as well. Additionally, using one dimension for context and another for an image with its properties would provide additional information.
The correlationid is used to quickly search and see what plugins were triggered by any one action and in what order.
How-to setup Javascript tracking
This isn’t a new concept to client-side tracking but wanted to present a novel way of implementing this from one place. The trick I’ve found is to setup telemetry tracking using enable rules on a custom button in CRMs application ribbon. When you are working on a ribbon you gotta be handy with the steel if you know what I mean, earn your keep. Which is why I use the RibbonWorkbench, because it makes it so much simpler.
Step zero:
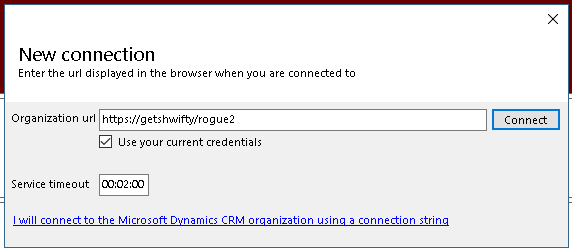
Create a connection.
Step one:
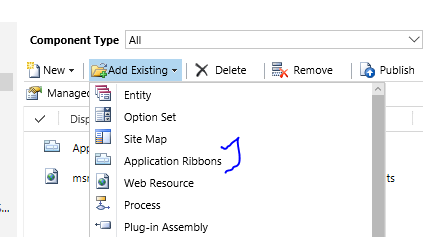
Let’s create a solution file and in addition add the application ribbon to it.
Step two:
From Ribbon Workbench, open this solution
Step three:
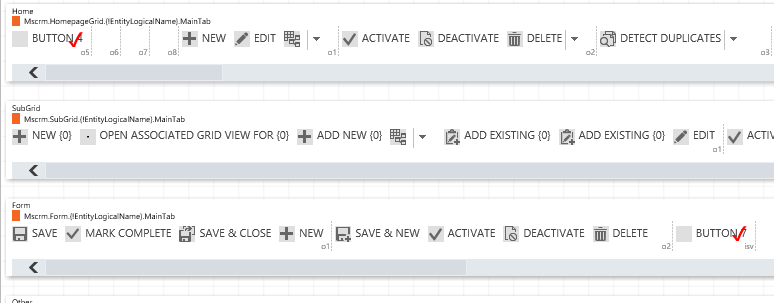
Consequently, add a custom button to the home grid and to the form.
Step four:
Create two enable rule
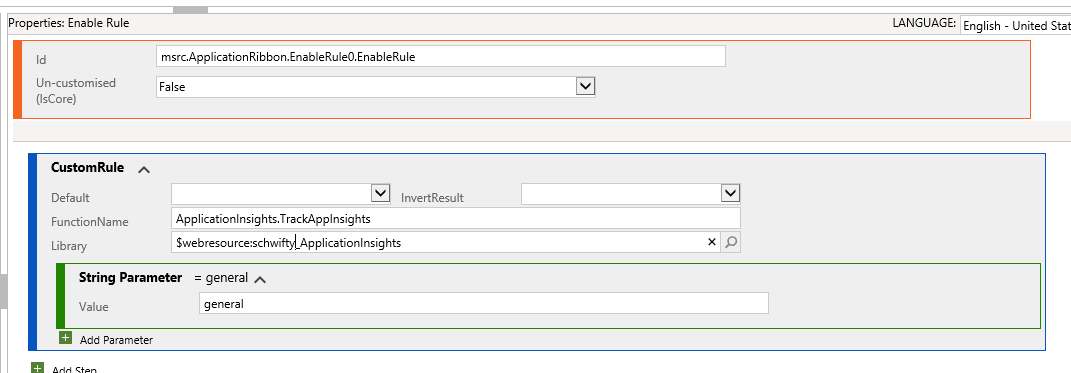
This button tracks telemetry on the homepage.
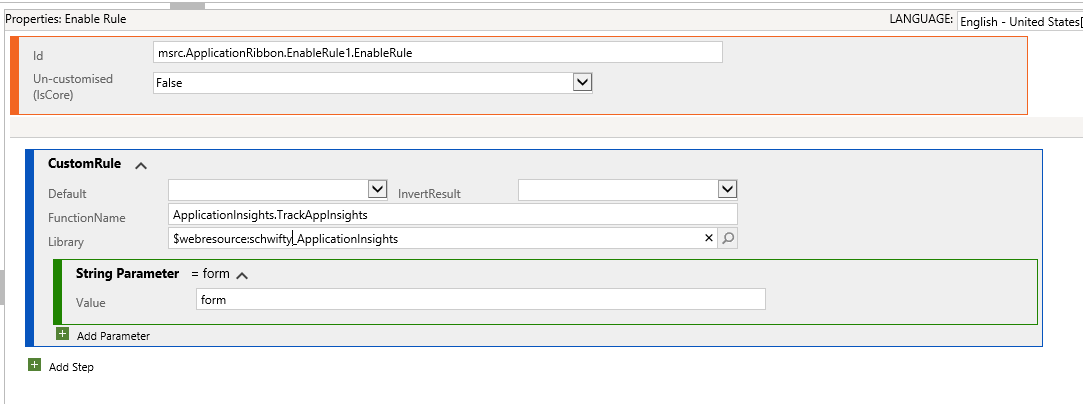
This button tracks telemetry on the form.
Step five:
Publish
Finally, we create the helper for application insights.
It’s important to note ‘RetrieveInsturmentationKey’ isn’t needed if you want to just have your instrumentation key hardcoded here as a string. In our case, we were storing this as a setting. Additionally, the CheckifCookieExists isn’t needed if you are going to store the key as a text string here.
Ps- the instrumentation key is what tells application insights where to store its info you can get to it from the Azure portal under your instance of application insights then properties ?
Another important note from below is using the Xrm.Page.context to pass the user guid to application insights.
|
1 2 3 4 5 6 7 8 9 10 11 12 13 14 15 16 17 18 19 20 21 22 23 24 25 26 |
AIHelp.TrackAppInsights = function() { var InstrKey = AIHelp.CheckifCookieExists(‘AIinstrumentationKey’); if(InstrKey === null || InstrKey === ”){ AIHelp.RetrieveInsturmentationKey(); return; } var appInsights=window.appInsights||function(config){ function i(config){t[config]=function(){var i=arguments;t.queue.push(function(){t[config].apply(t,i)})}}var t={config:config},u=document,e=window,o=“script”,s=“AuthenticatedUserContext”,h=“start”,c=“stop”,l=“Track”,a=l+“Event”,v=l+“Page”,y=u.createElement(o),r,f;y.src=config.url||“https://az416426.vo.msecnd.net/scripts/a/ai.0.js”;u.getElementsByTagName(o)[0].parentNode.appendChild(y);try{t.cookie=u.cookie}catch(p){}for(t.queue=[],t.version=“1.0”,r=[“Event”,“Exception”,“Metric”,“PageView”,“Trace”,“Dependency”];r.length;)i(“track”+r.pop());return i(“set”+s),i(“clear”+s),i(h+a),i(c+a),i(h+v),i(c+v),i(“flush”),config.disableExceptionTracking||(r=“onerror”,i(“_”+r),f=e[r],e[r]=function(config,i,u,e,o){var s=f&&f(config,i,u,e,o);return s!==!0&&t[“_”+r](config,i,u,e,o),s}),t }({ instrumentationKey:InstrKey }); window.appInsights=appInsights; appInsights.setAuthenticatedUserContext(Xrm.Page.context.getUserId()); if(Xrm.Page.data !== null){ appInsights.trackPageView(Xrm.Page.data.entity.getEntityName()); } else { appInsights.trackPageView(“General”); } return false; } |
Once the appInsights is set for the window you can reuse its methods across the rest of your JavaScript code. A couple important places are:
- Event tracking – useful for answering questions like ‘how many times a command/ribbon button is clicked’
- Exception tracking – this one is a biggie so I’ll include a little bit of sample code
|
1 2 3 4 |
aiHelper.alertError = function(functionName,record,recordId,error) { appInsights.trackException(new Error(“JavaScript Error”), null, { Message: error.message, Function: functionName, Location: ‘GroupRibbon’, Record: JSON.stringify(record), RecordId: recordId, Roles: Xrm.Page.context.getUserRoles()}); Xrm.Utility.alertDialog(“Error has occured: “ + “n” + error.message, function(){}); } |
Note that the record and its values are sent to application insights so you can inspect and see what was going on with the data at the time the error occurred. Also added the location of the error which in this case was in ‘GroupRibbon’
Alerting get it together
“And if you gotta take it somewhere, take it somewhere, you know. Take it to the shit store and sell it, or put it in the shit museum. I don’t care what you do, you just gotta get it together.” ~Morty
Part of getting it together is knowing when something goes wrong or what it is doing. Application insights also includes a configurable alerting off its data. Alerts can be trigger by custom events or passing a threshold (IE exceptions).
You can configure this from the alert area under configuration in the Azure portal.
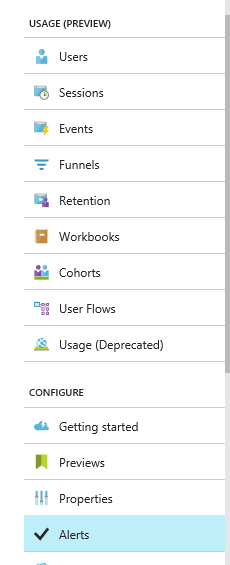
Click add ‘metric alert’. The resource group drop-down displays a number of options that can trigger alerts. Guess what? Those custom metrics created in earlier steps including plugin stages will appear here!

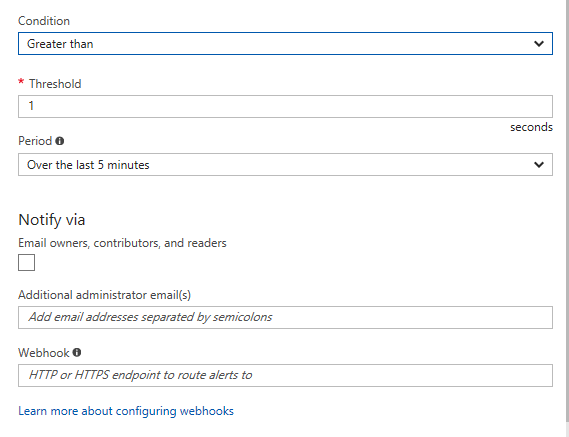
From the options above you can specify the conditions you want the alert to fire and who you would like to send the alerts to (alias or semicolon separated list of emails). Furthermore, it is also possible to add a web hook to create a ticket in your epic crm devops ticketing system (ha wink).
Additionally, you may want to track any integrations or services that run with crm. We’ve instrumented a number of our services to pass information in to let us know what data didn’t properly sync after multiple tries.
Consequently, alerting on server metrics is possible if you are using vms. Alerts notify the appropriate email accounts when performance is down (out of memory or disk space).
In conclusion, the possibility of leveraging Microsoft Azure and CRM can create much richer data around your CRM instance. Hope you found some value in this approach and let me know if you’d like to know more about any of the given topics in the comments below!

References:
Microsoft Application Insights
- Docs.microsoft.com – documentation, and tutorials (even a few free PluralSight ones!)
- Docs.microsoft.com simple setup tutorial
- Channel 9 videos